Overview
A company can describe its environmental footprint in a document; a satellite can observe the ground it stands on directly, independent of what the company chooses to disclose. That's the promise behind "geospatial ESG" — a fast-growing field that a joint 2022 WWF, World Bank, and Global Canopy report examined in detail, testing what's actually achievable today with real-world case studies from Brazil. The honest answer the report reaches is a genuinely useful one: geospatial data is already delivering real insight at the asset level, but it comes with well-documented limitations that mean it complements independent verification rather than replacing it.
What "Geospatial ESG" Actually Means
The report defines geospatial ESG as the use of geospatial data to generate ESG-relevant insight into a specific commercial asset, company, portfolio, or geographic area. The mechanism is direct: an asset's or company's location is geolocated ("asset data"), then compared against "observational data" — satellite-derived datasets covering deforestation, protected-area overlap, habitat fragmentation, land degradation, infra-red heat profiles (a proxy for power usage or emissions), marine oil spills, and much more. The appeal is equally direct: unlike a company's own disclosure, satellite observation doesn't depend on what the company chooses to report, and — combined with improving machine learning — it can, in principle, provide environmental insight that's independent, global, and repeatable at a scale no ground-based assessment could match. The report is explicit that this paper covers the environmental ("E") application specifically; geospatial data can be, and is being, used for social and governance purposes too, but that's outside its scope, and this guide follows the same environmental focus.
Two Approaches: Direct Measurement vs. Modelling
Geospatial ESG tools split into two broad families, and it's worth understanding the difference before trusting either one's output. Modelling/footprinting approaches start from a company's disclosed revenue and its industry classification (GICS, NACE, or similar), translate that into estimated production volumes, and then convert production and resource use into environmental-pressure metrics — land-use change, CO2 and methane emissions, freshwater pollution — often via an open-source model like the Global Biodiversity Model for Policy Support (GLOBIO). Direct geospatial measurement skips the financial-data translation step entirely: it geolocates the actual asset and compares it directly against observational satellite data. Neither approach is strictly better — modelling approaches can cover companies with no available asset-level location data, while direct measurement can achieve much higher spatial and temporal precision where asset data does exist — and the report's own view is that hybrid approaches drawing on both are the likely direction of travel, given how incomplete asset-location data remains for most sectors.
Three Scales: Asset, Company, and Sovereign
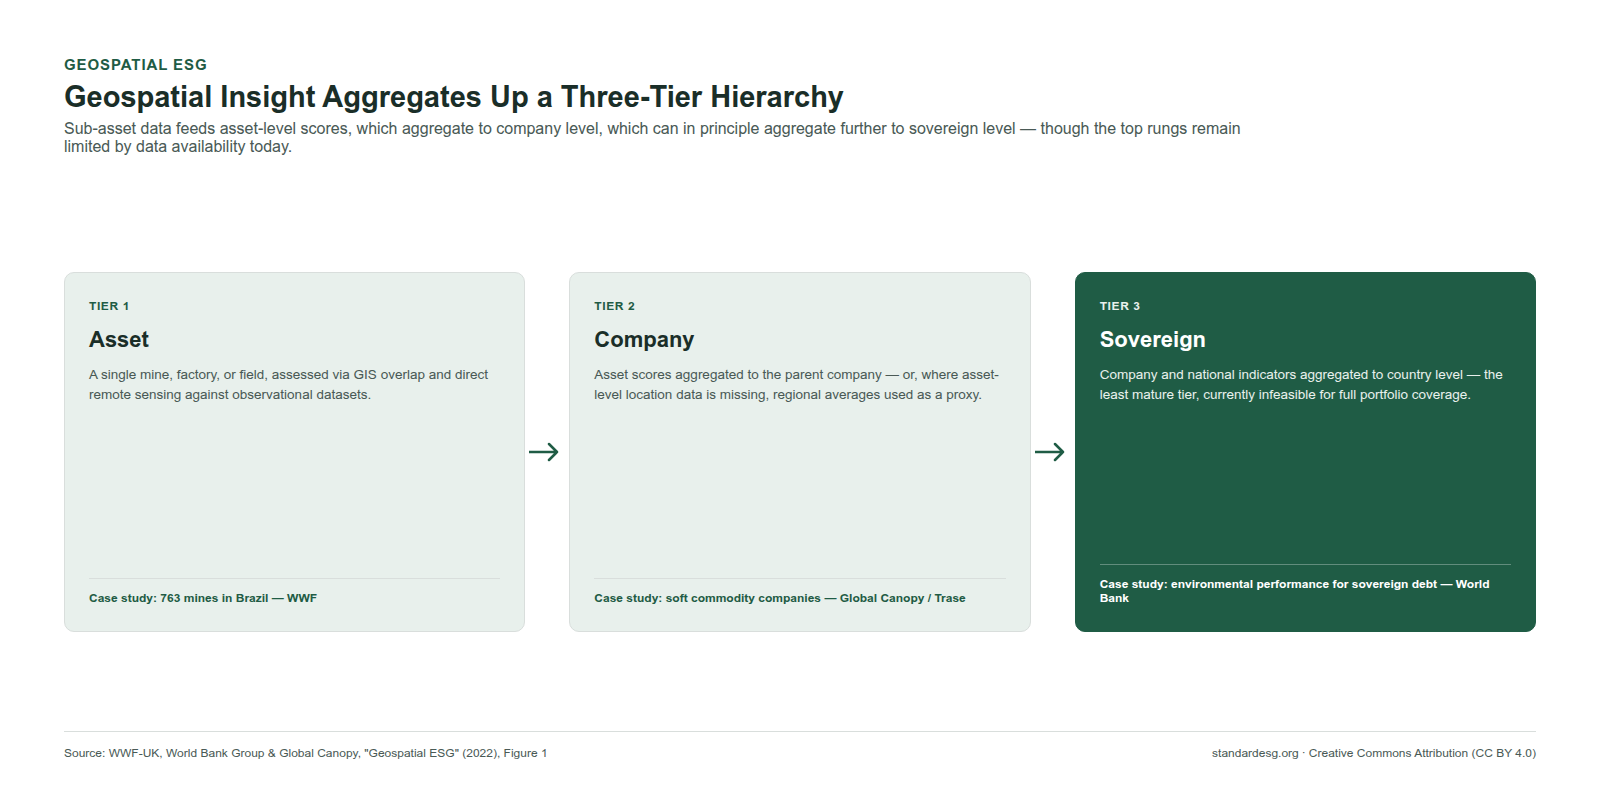
Geospatial ESG insight aggregates naturally up a hierarchy: sub-asset-level data (IoT, smart meters) feeds asset-level scores (a single mine, factory, or field, assessed via GIS overlap and remote sensing), which aggregate to company or parent-company level, which can in principle aggregate further to portfolio or country level. This is the same structural logic behind the three real-world case studies the report builds in Brazil — one at each scale: mining projects for project finance (asset level, led by WWF), soft commodity companies for corporate investment (company level, led by Global Canopy's Trase initiative, working around missing asset-level data by using region-level averages instead), and national environmental performance for sovereign debt investment (sovereign level, led by the World Bank). The report is candid that portfolio-level aggregation across a full range of sectors is "currently infeasible due to lack of asset data for all sectors" — geospatial ESG's aggregation ladder is real, but its top rungs remain more aspiration than current practice.
A Real Case Study: Mining in Brazil
The report's clearest demonstration of what's achievable today is its asset-level case study: WWF's Conservation Intelligence team compared all 763 identified commercial mines in Brazil against several open observational datasets — the World Database on Protected Areas, Key Biodiversity Areas (KBAs), World Heritage Sites, plus raster layers for biodiversity intactness, ground carbon, and forest loss. The results are concrete and specific: of 763 mines, 263 (34%) were active; of those, 31 overlapped with KBAs (26 entirely within one), 40 overlapped with a protected area (22 entirely within one), and one inactive mine sat within a World Heritage Site. Three illustrative mines — Aurizona (gold, Equinox Gold Corp), Capanema and Northern System (iron ore, both Vale S.A.) — were scored against a Biodiversity Intactness Index, ground carbon, and forest-loss metrics within a simple 1km² radius, producing a comparable, ranked score across all three despite their very different commodities and locations. This is a genuinely useful result: a consistent, repeatable, independently generated environmental screen across an entire national sector, built almost entirely from open data.
What the Case Study Revealed About Context
The same case study is equally valuable for what it reveals about how easily a geospatial score can mislead without careful interpretation. All three example mines predate the protected areas they now overlap — meaning current ownership didn't create the overlap, and unpicking historical responsibility across decades of changing ownership is genuinely difficult. A forest-loss metric measured a decade after a mine's initial development will show artificially low impact, because the deforestation already happened before the observation window began — the site "has long been deforested," in the report's own words, so a naive recent-years-only reading understates the mine's true historical footprint. And because many of the observational datasets used are forest-related (biodiversity intactness, ground carbon, forest structural indices), a naive comparison risks systematically penalizing forest-biome mines relative to savanna-biome mines simply because forest is the ecosystem type most of the available metrics were built to track — an artifact of data availability, not a genuine difference in environmental risk. None of this means the underlying case study is unreliable; it means a geospatial score, like any other single metric, needs interpretation in context rather than being read as a finished verdict.
Six Limitations of the Current Data
Beyond the interpretive issues in Section 5, the report identifies six structural limitations in the open environmental geospatial data landscape itself, based on assessing 105 commonly used datasets from the UN Biodiversity Lab:
- Temporal consistency: only 40 of 105 datasets (38%) had measurements for more than one year, and only 20 (19%) had consistent records spanning more than five years — yet the report considers five years of consistent data close to a minimum for reliable sovereign-level trend analysis.
- Accuracy: neither vector datasets (boundaries like protected areas, which can be contested or technically flawed) nor raster datasets (satellite-derived grids, whose accuracy depends on classification algorithms and often-limited ground validation) should be assumed perfectly accurate — caution is warranted even for the most-established products.
- Spatial resolution: of the 105 layers assessed, only 24 (22%) had a resolution at or below 100m; commercially available imagery reaches 30cm, but the cost of acquiring and processing it at that resolution is unviable for almost all open, academic, or NGO-funded products.
- Data interdependencies: many "new" datasets are themselves built by combining several older datasets — meaning an error or staleness in one foundational source can silently propagate through multiple downstream products presented as independent.
- Relevancy: thousands of candidate datasets exist for any given topic, with no clear consensus on which one an analyst should apply, and the datasets that exist skew toward topics that are technically easier to measure by satellite, not necessarily the topics that matter most.
- Biodiversity specifically: no team, group, or product has yet achieved a means of defining the impact of commercial operations on biodiversity at a global scale and high temporal frequency — see Section 7.
The report's own framing of the consequence is worth repeating directly: assuming a dataset captures an environmental metric more precisely than it actually does risks companies or investors believing their exposure is lower than it really is — which can, in the report's words, "aid greenwashing" and "slow the effectiveness" of capital reallocation toward genuine sustainability. Geospatial data's independence from company disclosure doesn't automatically make it more reliable than disclosure — it trades one set of limitations for a different one.
Why Biodiversity Is the Hardest Case
Biodiversity deserves its own callout because it resists quantification in a way most other environmental metrics don't: there is no single, agreed unit of biodiversity the way there's a ton of carbon. A "species" isn't a consistent unit either — each species carries different rarity, range, and ecological connectivity, so simply counting species present tells you far less than counting tons of a pollutant would. Even a purpose-built screening tool like the Integrated Biodiversity Assessment Tool (IBAT) — built from Protected Areas, Key Biodiversity Areas, and the IUCN Red List — can't tell an analyst whether a given protected area is pristine or already heavily degraded, because none of its source datasets capture site-level intactness directly. If a protected area was recently converted to, say, a plantation, that change may not be reflected in the underlying registry for some time — meaning a biodiversity screen can be confidently wrong about current ground conditions, not just imprecise about them.
What Commercial Providers Add on Top
Where open data hits these limitations, commercial providers have built proprietary techniques to push past them — illustrating what's technically achievable with more resources than an open dataset alone provides. One commercial satellite analytics provider, examined as a case study within the report, built a "Mine Activity Index" for one of the three case-study mines by combining stereoscopic 3D reconstruction (to estimate volume of material removed), Synthetic Aperture Radar (SAR) change-detection (comparing radar coherence between successive images to flag physical change pixel-by-pixel, unaffected by cloud cover), and multispectral land-cover classification — together tracing that single mine's surface-area growth from under 10km² in the late 1980s to over 40km² by 2020 using a continuous, decades-long Landsat archive. This kind of fused, multi-technique analysis is precisely what today's open datasets, taken individually, can't yet deliver at scale — and it's a preview of where the field is heading as machine learning and commercial satellite constellations continue to mature.
Where This Fits with Level 3 Verification
None of the above should be read as a case against Standard ESG's own on-site verification model — it's closer to a roadmap for what will eventually strengthen it. Level 3's checklist domain 8, data trail verification, already requires declared quantitative indicators — energy, water, waste, accident rates — to be traced back to meters, invoices, or logs during an on-site visit (see What to Expect from an On-Site ESG Assessment). A mature, well-validated geospatial dataset is a natural complement to that domain specifically: an auditor tracing a company's declared forest-cover or land-use figures could, in principle, cross-check them against an independent satellite record covering the same site and time period, the same way EITI's revenue reconciliation gives an auditor an independently verified figure to check a company's own numbers against (see Transparency in Extractive Industries §11). But Section 6's limitations matter enormously here: an auditor relying on this kind of cross-check needs to know a dataset's temporal consistency, spatial resolution, and accuracy before treating a mismatch as evidence of misreporting rather than a limitation of the satellite data itself. Geospatial data is a promising evidence source an on-site verifier can draw on — it is not, on the evidence this report presents, a substitute for the on-site verification process itself.
What This Means for a Company Today
For a company thinking about its own environmental evidence base, this report supports a specific, practical stance: geospatial monitoring is worth adopting as a complement to your own record-keeping, not as a replacement for it. A company operating a site with a meaningful land footprint — mining, agriculture, forestry, large-scale infrastructure — can reasonably expect its site's activity to already be independently, if imperfectly, observable from space; treating that as adversarial rather than useful is a missed opportunity, since a company's own declared land-use and forest-cover figures that are consistent with independently observable satellite data are stronger evidence than either source alone. At the same time, the honest limitations in Section 6 mean geospatial data isn't yet a substitute for the underlying meters, invoices, and logs that Level 2 and Level 3 evidence actually depend on — building both, rather than betting on the promise of satellite verification alone, is the more durable strategy while the field matures.
Standard ESG (standardesg.org) treats emerging verification technologies like geospatial data as a promising complement to, not a substitute for, the document review and on-site verification that Level 2 and Level 3 assessments are built on. See The Standard ESG Certification Protocol: A Public Overview for the full evidence architecture behind every certification level.
Was this page useful?