Overview
ESG Ratings vs. ESG Certification covers why ESG ratings diverge so sharply across the full E-S-G spectrum. This guide narrows in on a single, consequential question a 2022 OECD staff study set out to answer directly for the environmental "E" pillar specifically: when a company scores well on climate-relevant E pillar metrics, does that actually mean it's decarbonising? The OECD's empirical answer, built from a sample of more than 2,500 companies across four major rating providers, is a clear and specific no — with real consequences for any investor using E pillar scores as a low-carbon-transition proxy.
Why the E Pillar Gets Used as a Climate Proxy
As central banks and financial supervisors have turned their attention to climate transition risk, a growing number of market participants — including central banks themselves, per the Network for Greening the Financial System — have started using ESG ratings' environmental "E" pillar score as a practical proxy for how well-aligned a company is with an orderly low-carbon transition, largely for lack of a better widely-available alternative. The OECD's 2022 report tests that practice directly: it assembles a sample of more than 2,500 middle- and large-capitalisation companies across 50 jurisdictions, drawing on E pillar scores and their underlying input metrics from four major providers (Refinitiv, MSCI, Bloomberg, and RobecoSAM), and asks whether the resulting E scores actually align with the climate-transition factors — reduced greenhouse gas emissions, reduced emission intensity, increased renewable energy use and investment — they're being used as a stand-in for.
The Core Finding: High E Scores Don't Track Lower Emissions
The headline finding is unambiguous: high E pillar scores do not correspond with lower CO2 emissions. Comparing average CO2 emissions across four rating providers' score categories (poor, satisfactory, good, excellent), the OECD found no consistent downward trend — in some cases, companies with "excellent" E scores show higher average emissions than companies scoring "satisfactory," depending on the provider. This matters because it directly undercuts the E score's most basic implied promise: that a higher number means a lower-emitting, more climate-aligned company. It doesn't, at least not reliably, across the four major providers the OECD tested.
Nor Do They Track Emissions Change Over Time
The static emissions comparison in Section 2 leaves open one charitable interpretation: perhaps E scores reward companies who are reducing emissions over time, even if absolute emissions levels vary for other reasons like company size. The OECD tested this directly and found no such relationship either. Comparing each company's three-year percentage change in greenhouse gas emissions against its E score, and separately its three-year change in emission intensity (emissions relative to revenue), the OECD found no alignment in either case — companies that had meaningfully cut their emissions or their emission intensity over the prior three years were no more likely to carry a high E score than companies whose emissions had risen. The same held for forward-looking emission-reduction targets: companies that had set an emissions-reduction target — of any size — did not consistently receive higher E scores than companies with no target at all. Together, these findings rule out both a backward-looking ("has this company actually cut emissions?") and forward-looking ("has this company committed to cutting emissions?") explanation for what drives a high E score.
What Does Predict a High E Score? Size and Disclosure
If actual emissions performance doesn't explain E score variation, what does? The OECD's analysis points to two factors that are not, in themselves, climate-transition measures at all. First, environmental scores correlate more strongly with market capitalisation than with any climate metric tested — larger companies systematically score higher, echoing the same size-and-disclosure-capacity bias found in the OECD's companion research on ESG investing broadly (see ESG Investing in Practice §4). Second, environmental R&D expenditure and general environmental expenditure — both plausible climate-transition inputs — show no consistent correlation with E scores either, meaning even direct investment in decarbonisation-relevant activity isn't reliably what's being rewarded. The OECD's own conclusion is pointed: E pillar scores appear to place less weight on negative environmental impacts and more on the existence of climate-related corporate policies and disclosure capacity — factors correlated with, but distinct from, actual climate transition action.
Disclosure of Policies, Not Quality of Targets
Digging further into what does correlate with a high E score, the OECD found that companies scoring well disclose more — specifically, they are more likely to disclose recognition of climate-related risks and opportunities, more likely to disclose emission-reduction policies and targets, more likely to disclose an internal carbon price, and more likely to disclose an environmental management team. This is a genuine signal, but a narrower one than it first appears: these are almost entirely binary disclosure metrics — does the company disclose a policy, yes or no — rather than measures of whether that policy's targets are actually ambitious or scientifically credible. Reviewing companies' own transition plans against two established disclosure frameworks, the OECD found that on average, companies covered only 51% of the ICMA Sustainability-Linked Bond Principles handbook's expected content and 68% of the TCFD framework's expected content in a clear, precise format — meaning even the disclosure this pillar appears to reward is frequently incomplete or unclear, not just non-quantitative. As the OECD puts it directly: metrics on disclosure often measure only the existence of a company's policies and targets, not whether those targets are actually in line with the latest climate science or a credible 1.5–2°C decarbonisation pathway.
Checking Against Independent Transition Frameworks
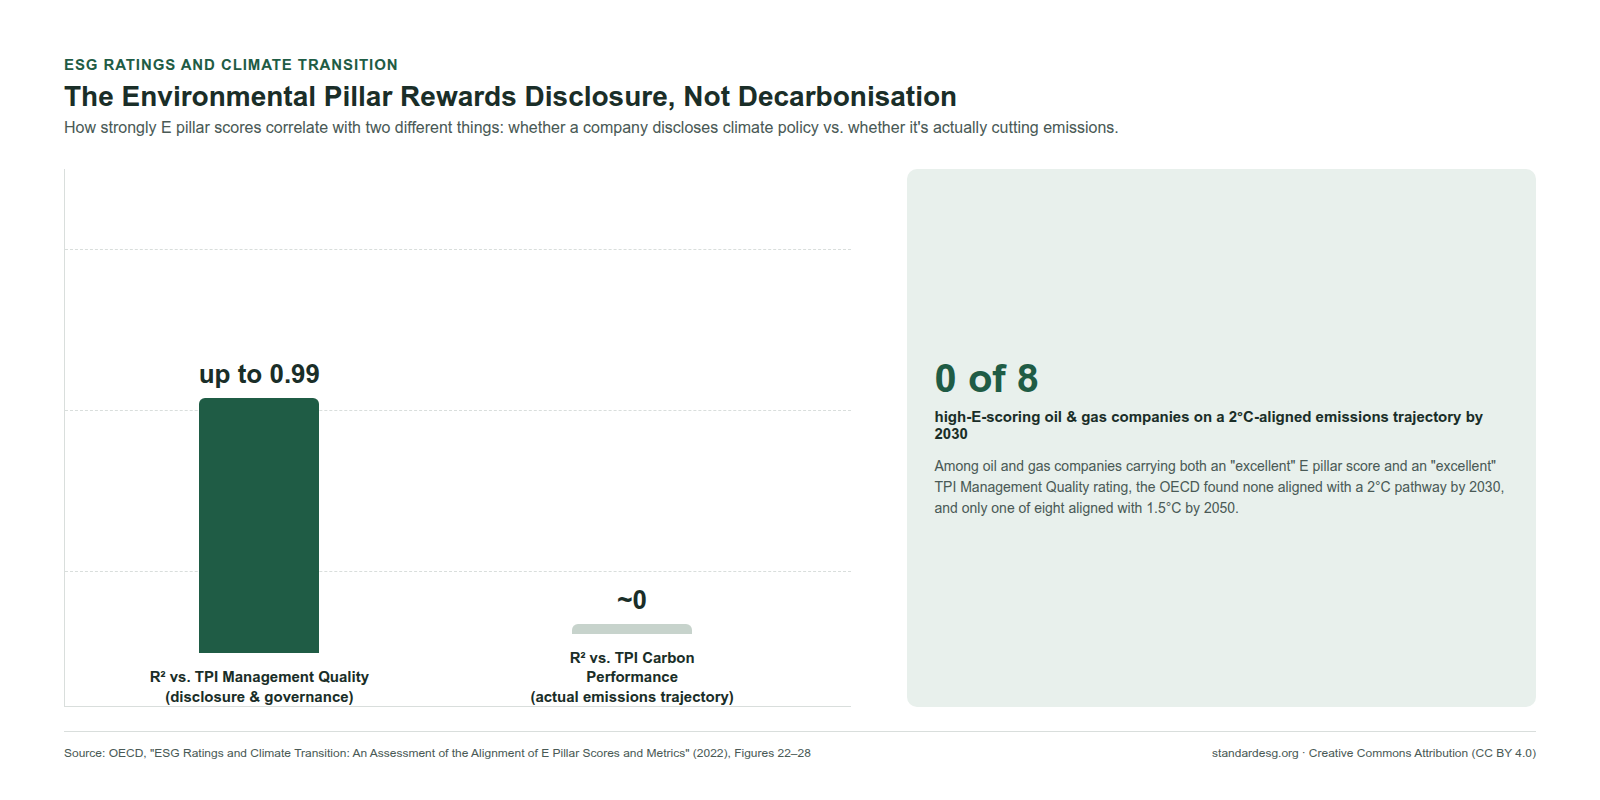
To test E scores against a genuinely independent climate-specific benchmark, the OECD compared them with the Transition Pathways Initiative (TPI) — a framework that separately scores companies on Management Quality (the quality of a company's governance and disclosure of GHG-related risk) and Carbon Performance (whether a company's actual emissions trajectory aligns with a 2°C or 1.5°C pathway). The result reinforces Sections 2–5 precisely: E pillar scores show a meaningfully positive correlation with TPI's Management Quality indicator (R² as high as 0.99 for one provider) — because Management Quality itself is substantially a disclosure and governance measure — but essentially no correlation with TPI's Carbon Performance indicators: neither current carbon-intensity level nor the change in carbon intensity over time shows any meaningful relationship with E scores. This is the clearest possible confirmation of the report's central diagnosis: E pillar scores track how well a company talks about climate risk management, not how well it is actually decarbonising.
Sector Case Studies: Oil and Gas vs. Utilities
The OECD's sector-level case studies make the gap concrete. Among oil and gas companies with both an "excellent" E score and an "excellent" TPI Management Quality rating, none showed a carbon-emissions trajectory consistent with a 2°C pathway by 2030, and only one of eight showed a trajectory consistent with a 1.5°C pathway by 2050 — despite each carrying the E pillar's top rating. The automotive sector tells a more encouraging story: high-E-scoring automakers' emissions projections track within the range of countries' own Paris pledge commitments, plausibly reflecting the sector's genuine structural advantages (fewer stranded-asset risks, heavy committed capital expenditure toward electrification already underway). Electric utilities and renewable energy companies show the strongest alignment of the three sectors: 11 of 12 high-E-scoring, high-Management-Quality utilities were on a trajectory consistent with halving their emissions by 2050, which the OECD attributes to the sector's structural advantage of building new low-carbon capacity rather than needing to write down extensive legacy fossil-fuel assets. The contrast across these three sectors is itself informative: the E pillar's disconnect from actual decarbonisation performance isn't uniform — it's worst precisely in the sector (oil and gas) where the gap between climate rhetoric and climate reality carries the most financial-stability significance.
Why This Compounds the Divergence Problem
This report's findings sit alongside, and compound, the general ESG ratings divergence problem described in ESG Ratings vs. ESG Certification: it isn't just that different providers' E scores disagree with each other (a comparability problem) — it's that even a single provider's E score may not measure what it's commonly assumed to measure at all (a validity problem). Both problems point the same direction for an investor: an unverified E pillar number, however internally consistent one provider's own methodology may be, is a weak substitute for independently checking a company's actual emissions trajectory and target credibility.
Policy Recommendations
The OECD's report closes with concrete recommendations for central banks, supervisors, and market regulators, all aimed at closing the gap this guide describes: strengthen disclosure-based metrics so they measure the quality of climate targets and their alignment with credible decarbonisation pathways, not merely whether a policy exists in binary form; build on 2021 TCFD guidance to improve the granularity, reliability, and consistency of climate-related metrics, targets, and transition plans specifically; integrate genuinely forward-looking, outcome-based metrics — actual emissions and emission-intensity trends, not just disclosure — into E pillar score construction where appropriate; push ESG rating providers toward greater transparency about which sub-components (climate risk, climate opportunity, GHG emissions, decarbonisation targets) make up a published E score, so a reader can tell which part of the number to trust for a climate-specific decision; and establish more rigorous surveillance of whether companies are actually implementing the targets and transition plans they disclose, rather than treating disclosure itself as the finish line.
What This Means for a Climate-Focused Investor
For an investor specifically trying to align a portfolio with climate-transition objectives, this report supports a narrow but important conclusion: don't use an unverified E pillar score as a climate-alignment proxy on its own. Where a genuine climate-transition assessment is needed, prefer frameworks purpose-built for it — the Transition Pathways Initiative's Carbon Performance indicator, Science Based Targets initiative validation, or an issuer's own IFRS S2 GHG Scope 1–3 disclosure and scenario analysis (see IFRS S1 and S2 Explained §7–8) — over a generic E pillar number whose main documented driver is company size and disclosure completeness rather than emissions performance. And where a company's own Level 2 or Level 3 evidence includes independently verified GHG data and decarbonisation targets, that verified evidence is a structurally stronger climate-alignment signal than any of the four E pillar scores this report tested, precisely because verification tests the substance behind the disclosure that E scores otherwise reward at face value.
Standard ESG (standardesg.org) requires GHG Scope 1–2 disclosure (Scope 3 encouraged) as an evidence-backed indicator under subject E3, verified rather than merely disclosed at Level 2 and Level 3 — the structural answer to exactly the disclosure-without-substance gap this report documents in E pillar scores generally. See The Standard ESG Certification Protocol: A Public Overview for the full evidence architecture.
Cette page vous a-t-elle été utile ?