Overview
ESG and Financial Performance lays out what the broad academic evidence says about ESG and returns. This guide looks at a narrower, more practical question a 2020 OECD staff study set out to answer directly: how are institutional investors and asset managers actually adopting ESG in practice, and what does the underlying market data reveal about the ratings and scores driving that adoption? The answer is a genuinely useful complication — adoption is real and growing fast, but the market-coverage and provider-consistency data underneath it raises questions any investor building an ESG-informed process should take seriously.
Why the OECD Looked at This
By the time the OECD conducted this analysis, ESG investing had moved from a niche practice to a mainstream feature of institutional finance — assets under management in ESG-labelled funds rose roughly 60% between 2012 and October 2018, from USD 655 billion to USD 1.05 trillion, and fund launches grew from 140 to 564 over roughly the same period. That scale of growth is precisely why the OECD judged the underlying data worth scrutinising directly rather than taking market growth itself as proof the underlying scores are reliable: a rapidly growing pool of assets is being allocated using ESG scores and ratings whose methodology, coverage, and consistency vary substantially by provider, a theme this guide traces through the OECD's own empirical testing.
Why Investors Say They Adopt ESG
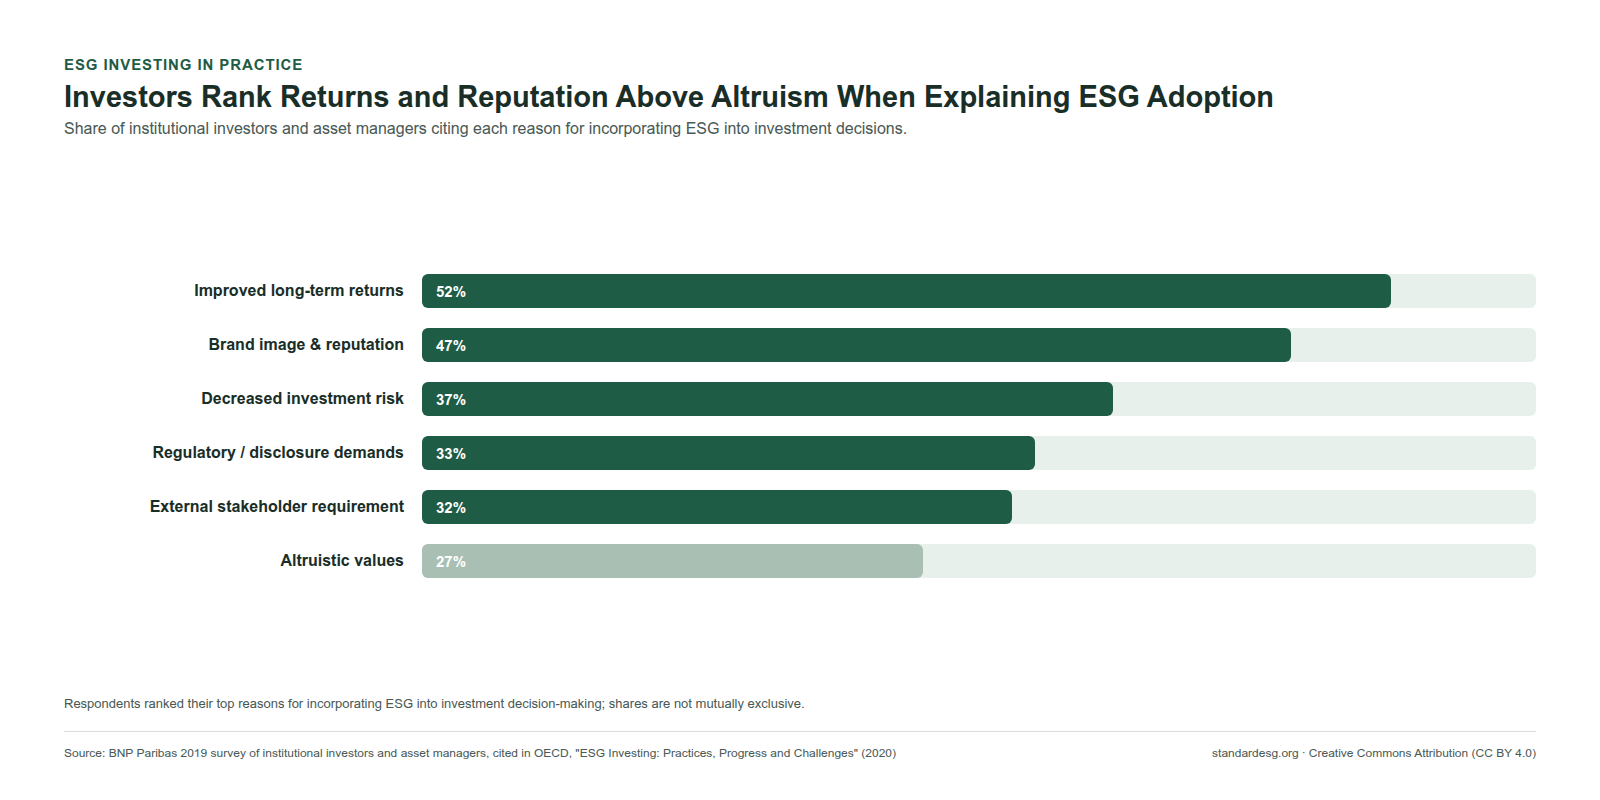
Survey evidence gives a consistent, if not perfectly uniform, picture of why institutional investors and asset managers actually incorporate ESG into decision-making. A Morgan Stanley study of 120 institutional investors found 70% had already integrated sustainable investment criteria into their decision-making, with a further 14% actively considering it. A 2019 BNP survey of institutional investors and asset managers asked respondents to rank their reasons for incorporating ESG, and found a clear hierarchy: improved long-term returns (52%), brand image and reputation (47%), decreased investment risk (37%), regulatory/disclosure demands (33%), and external stakeholder requirements (32%) — with altruistic values ranking markedly lower, at 27%. This ordering matters: it confirms that ESG adoption is predominantly framed by practitioners themselves as a performance- and risk-management-driven decision, not primarily a values-driven one, which is consistent with the risk-management framing ESG and Financial Performance draws from the broader academic evidence.
The ESG Financial Ecosystem
Part of what makes ESG investing harder to evaluate than it first appears is the sheer number of distinct actors now sitting between a company's disclosure and an investor's final decision: issuers and investors sit at either end, but an intertwined network of financial intermediaries, data and ratings providers, index providers, and a wide array of governmental, private-sector, and international standard-setting organisations now actively shapes what gets measured and how. The OECD's own framing is direct about the consequence: this rapid institutionalisation has clear benefits — more forward-looking information, better-aligned strategic asset allocation, and stronger incentives for responsible business conduct — but ESG practices remain at a relatively early stage of development, and the many institutions building frameworks and metrics have not yet converged on common, globally consistent terms and practices. That's the structural backdrop for the specific data problems in Sections 4–6.
Market Coverage Is More Concentrated Than It Looks
The OECD's analysis of Refinitiv data reveals a market-coverage pattern worth understanding before trusting any single ESG score's representativeness. By company count, ESG score coverage is genuinely limited: even after growing steadily, only about 25% of US public companies carried an ESG score by 2019, roughly 10% in the EU and worldwide, and just over 5% in Japan. But looked at by market capitalisation rather than company count, the picture inverts sharply — companies carrying an ESG score represented 95% of total US market capitalisation, 89% in the EU, and 78% each in Japan and worldwide. In other words, ESG scoring coverage is heavily concentrated in the largest companies by market value, not evenly spread across the listed universe. The OECD's own explanation is direct: larger companies are more followed by analysts and investors and have more resources to invest in disclosure, while smaller companies face the same minimum disclosure costs with far less capacity to absorb them — a structural bias that means an ESG-tilted portfolio strategy is, in practice, disproportionately a large-cap strategy, whatever else it's nominally screening for.
The OECD's Own Portfolio Testing
Rather than relying solely on prior academic literature — which the OECD found to be "largely mixed and somewhat inconsistent," varying by provider, strategy, geography, and timeframe — the OECD staff conducted its own empirical portfolio analysis, applying Modern Portfolio Theory concepts (the Markowitz efficient frontier and the Fama-French five-factor model) to ESG-screened portfolios built from MSCI, STOXX, and Thomson Reuters index data across 2009–2019. The headline finding is blunt: there is no consistent evidence that high-ESG-scoring portfolios outperform the market, and the direction and magnitude of any difference depends heavily on which provider's data underlies the portfolio, not on some shared, provider-independent "ESG effect." Using the Fama-French model to compare top-quintile against bottom-quintile ESG portfolios across five different providers, the OECD found that low-ESG-scoring portfolios generated higher risk-adjusted alpha than high-scoring ones for four of the five providers tested — the opposite of what a simple "ESG investing outperforms" narrative would predict.
Lower Drawdown, Inconsistent Alpha
The OECD's testing did surface one genuinely consistent pattern across providers: ESG indices showed lower maximum drawdown risk — a measure of how far a portfolio falls from its prior peak during a downturn — than comparable non-ESG indices, including during the Covid-19 market shock. This is a materially narrower and more defensible claim than "ESG portfolios outperform": it says high-ESG portfolios tend to fall less during a crisis, not that they earn more over time, echoing the downside-protection framing (rather than an outperformance framing) that ESG and Financial Performance §3 draws from the wider public-equities literature. Reducing the diversification of a portfolio through ESG screening also carries a real, mechanical cost the OECD is careful to flag: concentration risk, which generally raises return volatility even where it may reduce certain tail risks — meaning any ESG-screening strategy trades one kind of risk exposure for another, not risk for a free lunch.
Five Policy Considerations
The OECD frames its findings not as a case against ESG investing, but as a case for addressing specific, identifiable weaknesses before markets rely on ESG data more heavily than its current quality supports. Several considerations for policymakers and market participants follow directly from the evidence above: strengthening the consistency and comparability of ESG metrics and methodologies across providers; addressing the market-capitalisation and disclosure-capacity bias documented in Section 4, which structurally disadvantages smaller companies regardless of their actual ESG performance; improving transparency into how individual providers weight and construct their scores, given how much portfolio outcomes in Section 5 depend on provider choice; building better tools to help investors understand what a given screening strategy's concentration-risk trade-off actually is; and continuing to develop the kind of rigorous, independent empirical testing this report itself conducts, rather than relying on providers' own marketing claims about ESG performance.
What This Means for an Investor's Process
- Never assume market-cap-weighted ESG coverage represents the full listed universe: a portfolio built from "companies with an ESG score" is implicitly tilted toward large caps before any active decision is made.
- Test provider choice explicitly, not just strategy choice: the OECD's own Fama-French results show provider selection can flip the sign of measured alpha, which means a single provider's back-test is not a reliable guide to another provider's scores.
- Treat drawdown protection, not outperformance, as the defensible claim for ESG-screened portfolios, consistent across the OECD's own testing and the broader meta-analytic evidence in ESG and Financial Performance.
- Weight data by its verification depth, not just its availability, for the same reason How Certification De-Risks ESG Due Diligence argues for using independently verified evidence alongside — not instead of — broad ratings coverage: a self-reported, unverified ESG score inherited the same market-cap and disclosure biases this guide documents, regardless of which provider produced it.
Standard ESG (standardesg.org) certifies companies at a stated, independently verifiable depth specifically because self-reported ESG data — the input behind every score discussed in this guide — carries the disclosure-capacity and coverage biases the OECD's own research documents. See How the Standard ESG 1–10 Score Works for how verification depth is built into the score itself.
Cette page vous a-t-elle été utile ?