Overview
Sovereign bonds are the largest asset class in the world, and a growing share of the investors who buy them now want an ESG score for the country issuing the debt, not just the company. A cottage industry of sovereign ESG providers has emerged to supply exactly that — but a landmark World Bank empirical study found something the industry itself didn't fully anticipate: most of what these scores measure isn't sustainability performance at all. It's national income. This guide explains how sovereign ESG scoring actually works, why it converges the way it does, and why that's a fundamentally different problem from the one Standard ESG's company-level certification model is built to solve.
What "Sovereign ESG" Means
Sovereign ESG applies the same three-letter framework used to score companies — Environmental, Social, and Governance — to countries instead, aiming to give sovereign bond investors a sustainability signal analogous to what corporate ESG ratings promise for equities and corporate bonds. The appeal is straightforward: sovereign debt is the largest asset class globally, ESG integration has become the dominant form of sustainable finance, and sovereigns play an outsized role in the very things ESG investing cares about — national climate policy, social outcomes, and institutional governance. But sovereign ESG sits inside a genuinely different financial ecosystem than corporate ESG: credit rating agencies, ESG rating providers, ESG index providers, asset managers, and institutional investors all sit between the sovereign issuer and the end investor, and — unlike a company, which controls its own disclosure — a country's sustainability-relevant data depends heavily on national statistical capacity, which itself scales with development level.
Who Supplies These Scores
Six providers dominate the sovereign ESG landscape covered by the World Bank's analysis: FTSE Russell/Beyond Ratings, ISS, MSCI, RepRisk, Robeco (formerly RobecoSAM), Sustainalytics, and V.E (formerly Vigeo Eiris). Investors rarely rely on a single provider — a 2021 J.P. Morgan survey found that 71% of respondents combine third-party ESG providers with in-house analytics, 36% license three or more providers at once, and Sustainalytics and MSCI were used by a full third of respondents, far ahead of any other single provider. That reliance on multiple providers is itself a signal: the sovereign ESG industry is still young enough that no single methodology has become a trusted default, unlike, say, sovereign credit ratings, where a small number of established agencies dominate.
The Headline Finding: Convergence, Not Divergence
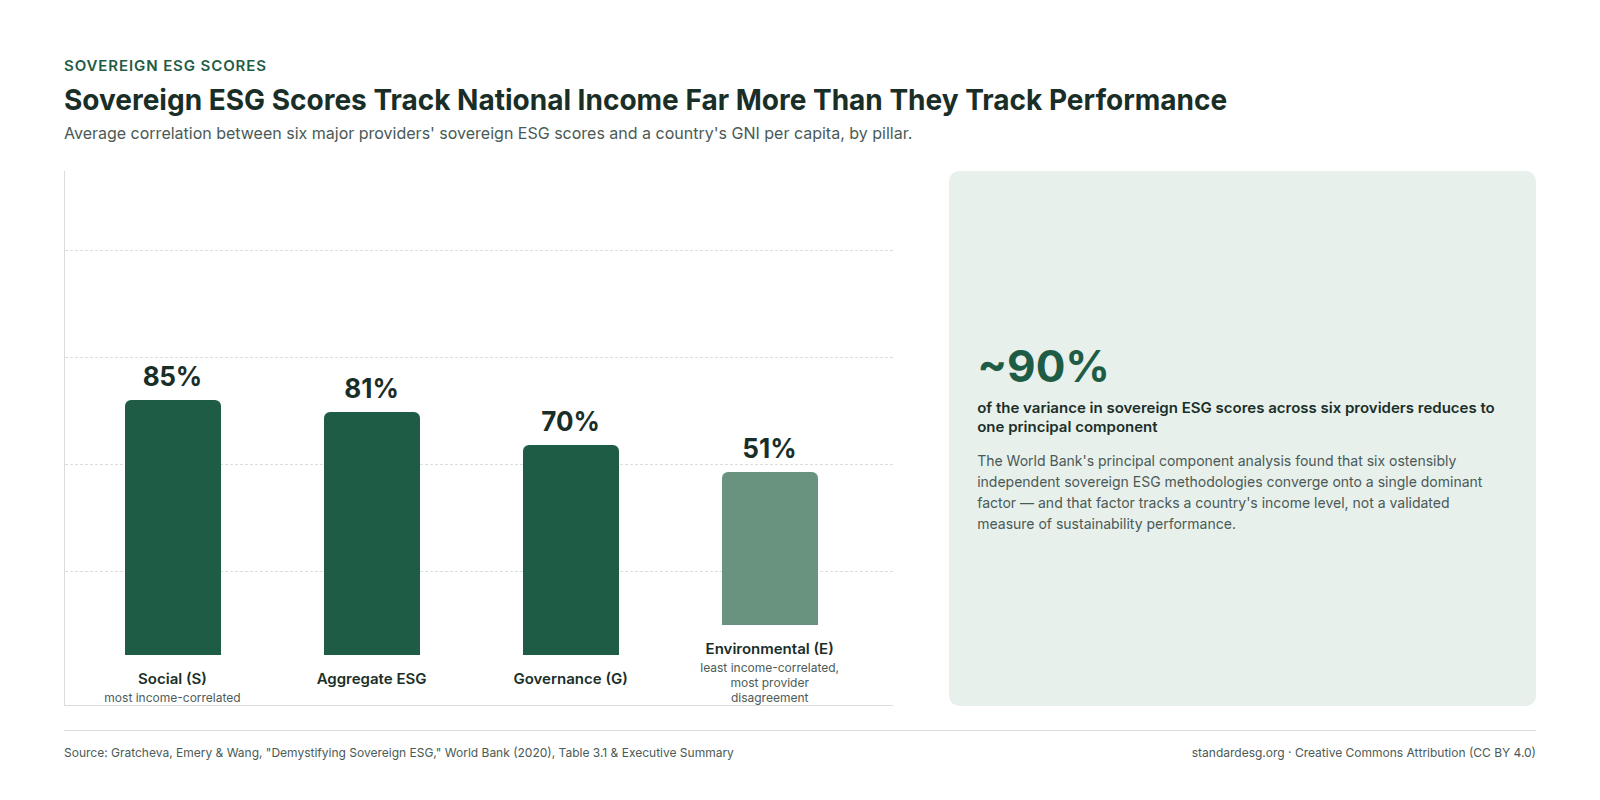
Corporate ESG ratings are notorious for disagreeing with each other — the phenomenon researchers call "aggregate confusion" (see ESG Ratings vs. ESG Certification for the full diagnosis at company level). Sovereign ESG scores show the opposite pattern: they converge strongly across providers. Using principal component analysis across 133 countries, the World Bank found that a single underlying factor explains nearly 90% of the variance in aggregate sovereign ESG scores across all six providers — meaning most of the information in six supposedly independent scoring methodologies reduces to one thing. That single dominant factor is not some shared, well-validated definition of sustainability. It's a country's income level.
The Ingrained Income Bias
The World Bank's correlation analysis is stark. Averaged across the six major providers, aggregate sovereign ESG scores correlate with a country's GNI per capita at 81% — and individual pillars diverge sharply in how exposed they are to this bias:
- Social (S) pillar — correlation with national income: 85%.
- Aggregate ESG — correlation with national income: 81%.
- Governance (G) pillar — correlation with national income: 70%.
- Environmental (E) pillar — correlation with national income: 51%.
The researchers call this the ingrained income bias (IIB): because indicators like labour-force participation, electricity access, political stability, and rule of law don't exist independently of a country's income and development history, any cross-country score built substantially from them will structurally reward wealth, whatever else it's nominally measuring. This isn't unique to ESG scores, either — the World Bank found the same pattern in other widely used sustainability-linked indexes: the UN's Sustainable Development Goal (SDG) Index correlates with income at 84.7%, the Yale Environmental Performance Index (EPI) at 86.9%, and the Notre Dame Global Adaptation Initiative (ND-GAIN) Country Index at 91.0%.
Why Income Bias Matters: Two Consequences
The World Bank's report draws out two distinct, and both troubling, consequences of the ingrained income bias:
- Perverse investment outcomes: tilting a portfolio toward higher sovereign ESG scores, unadjusted for income, systematically tilts that portfolio toward wealthier countries — rewarding prosperity the score didn't actually measure, at the expense of lower-income countries that may have the greatest need for sustainable-development financing and, per some analysts, the greatest room for measurable improvement.
- Disheartening policy incentives: a country's income level is the product of decades or centuries of development, not something a government can meaningfully shift in a single policy cycle. If sovereign ESG scores are dominated by that slow-moving variable, the score gives policymakers little useful short-run feedback on whether their sustainability-specific reforms are actually working.
A parallel finding in corporate ESG scoring — that larger companies score more highly independent of their actual sustainability performance, because bigger firms have more capacity to supply ESG data — suggests this isn't a sovereign-specific quirk. It's what happens whenever a scoring methodology's inputs correlate strongly with an entity's sheer capacity to generate reportable data, whether that entity is a company or a country.
The Environmental Pillar Is Different
The E pillar breaks the general convergence pattern in two directions at once, and both matter for anyone using these scores. First, it's the least income-correlated pillar (51%, versus 70–85% for G and S) — a country's environmental performance genuinely does not track its wealth as tightly as its governance or social indicators do. Second, and in tension with that, it's also the pillar where providers disagree with each other most: the World Bank's cluster analysis found that for aggregate ESG, S, and G scores, most providers group into one or two clean clusters of broad agreement, but for E scores alone, nearly every provider forms its own separate cluster — a genuinely fragmented picture, not a converged one. The report attributes this to several compounding factors: environmental data lags of roughly five years on average, no market consensus on what counts as "good" environmental performance, environmental risks materialising over much longer time horizons than social or governance risks, and the fundamentally nonlinear way environmental degradation actually behaves (Section 7). In practice, this means the E pillar is simultaneously the part of sovereign ESG least distorted by income — and the part an investor should trust least for consistency across providers.
Attempts to Fix It — and Why They Fall Short
Practitioners are aware of the ingrained income bias and have tried to correct for it — most commonly by linearly adjusting scores for GDP per capita, an approach used in practice by the Notre Dame Global Adaptation Initiative, and proposed independently by Renaissance Capital and Morgan Stanley Investment Management analysts. The World Bank tested this directly: after linearly removing the income effect, the first principal component still explains more than 70% of the variance in sovereign ESG scores (down from ~90%, but still dominant) — and, more strikingly, the adjusted scores reveal a U-shaped, nonlinear relationship with income that a simple linear adjustment can't remove. Both high- and low-income countries score relatively well on the income-adjusted scale; middle-income countries score worst. This pattern echoes the environmental Kuznets curve — the hypothesis that environmental degradation rises through early industrialisation and then falls again as an economy matures, regulation strengthens, and cleaner technology becomes available — a real but genuinely debated economic relationship, and one whose reliability is particularly questionable for degradation that's irreversible, such as biodiversity loss. The takeaway isn't that income adjustment is worthless; it's that no adjustment method currently in practical use — linear or otherwise — fully separates "sustainability performance" from "stage of economic development" in a sovereign ESG score.
How Providers Actually Differ
Given that overall scores converge so strongly, where do the six major providers actually diverge? The World Bank's analysis of providers' own technical and marketing documents found genuinely distinct positioning: MSCI, Robeco, and FTSE Russell/Beyond Ratings cluster together as more balanced, general-purpose providers, while ISS, V.E, and RepRisk are more specialised — Sustainalytics stands apart as the only provider building its methodology around World Bank wealth-accounting data (natural, human, and produced capital), RepRisk is oriented toward corporate reputational risk exposure within a country rather than a direct sustainability measure, and ISS leans more heavily on SDG-related materiality framing than the others. This matters practically: an investor choosing among providers is choosing a genuinely different analytical lens (wealth accounting vs. reputational risk vs. SDG alignment), even though the resulting aggregate scores will, per Section 3, end up highly correlated with each other anyway.
Sovereign ESG vs. Standard ESG: A Different Problem Entirely
None of this is a critique of certification schemes like Standard ESG, which operates at a structurally different level and solves a different problem. Standard ESG certifies individual companies, not countries, against a versioned, industry-specific assessment template, with claims tested against submitted documents (Level 2) and on-site verification (Level 3) — see The Three Certification Levels Explained. A company's certificate reflects that specific company's own governance, environmental management, and social practices, independent of the wealth level of the country it operates in — the entire evidence and scoring architecture is built around one company's own documented performance, not a macroeconomic proxy. Sovereign ESG, by contrast, is trying to compress an entire country's institutions, environment, and social outcomes into a single comparable score using largely macro-level statistical indicators — indicators that, as this report shows, are themselves entangled with income in ways no current methodology fully disentangles. This isn't a claim that Standard ESG "does sovereign ESG better"; it's a structural point that company-level certification and sovereign-level scoring are answering different questions with different tools, and the well-documented limitations of one shouldn't be assumed to carry over to the other.
What This Means for Investors
For an investor actually using sovereign ESG scores in practice, the World Bank's findings suggest a few concrete habits:
- Never read an unadjusted sovereign ESG score as pure sustainability signal: a large share of what it measures is a country's income level, however the provider labels it.
- Treat the E pillar with particular caution: it's the pillar with the weakest provider consensus, and the underlying environmental data itself lags by years in many countries.
- Ask what a provider's score is actually built from before comparing it to another provider's: a wealth-accounting-based score (Sustainalytics) and a reputational-risk score (RepRisk) are measuring genuinely different things even when their final numbers move together.
- Treat income-adjusted scores as an improvement, not a solution: the nonlinear U-shaped bias that survives adjustment means even "adjusted" sovereign ESG scores still need to be read with real scepticism about what they capture.
Standard ESG (standardesg.org) certifies individual companies against a documented, evidence-based standard — a structurally different exercise from sovereign-level ESG scoring. See The Standard ESG Certification Protocol: A Public Overview for how company-level scoring is built to avoid exactly the kind of proxy-variable distortion described in this guide.
Cette page vous a-t-elle été utile ?